Perfect Substitute Goods are those goods that can satisfy the same necessity in exactly the same way. A substitute good can be used in place of another. If the consumer can choose between buying one substitute good or another, she will buy the cheaper one.
Examples of Perfect Substitute Goods:
- A one-dollar bill is a perfect substitute for another one-dollar bill.
- Commodities: soybeans that are of the same quality.
- Electricity from different power plants. A person cannot differentiate from which power plant does the electricity she uses comes from.
- Very similar goods from different providers. For example, compact disks (CDs) from different providers.
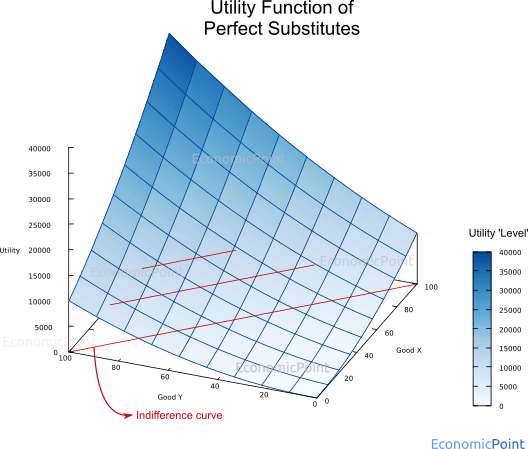
Utility Function of Perfect Substitute Goods
The utility provided by substitute goods is an increasing function of the sum of the quantity of each good. Several utility functions satisfy this requirement.
For example, the following function is a utility function of two perfect substitute goods:
U = x + y (1)
The following chart describes this utility function.
Figure 1: Linear Utility Function of Two Perfect Substitute Goods
If we have three substitute goods instead of two:
U(x,y,z) = x + y + z (2)
Since we are analyzing a cardinal utility function, any transformation that preserves the order of the original set can be used to describe the utility function of substitute goods.
For instance, the following transformation can be applied to (1)
U(x,y) = (x + y)2 = x2 + 2xy + y2 (3)
And the following chart describes this utility function:
Figure 2: Utility Function of Perfect Substitute Goods (Monotonic Transformation of a Linear Utility Function)
Another example of a utility function that describes two perfect substitutes is:
U(x,y) = 2x + 2y (4)
And a general formula is:
U(x,y) = ax + ay (5)
And any monotonic transformation of the previous formula also describes the utility function of perfect substitute goods.
Indifference Curve for Perfect Substitute Goods
If a person consumes one less unit of a perfect substitute good, she will need an additional item of the other perfect substitute to keep the same utility level. An indifference curve is a line showing all the combinations of two goods that give a consumer equal utility. Thus, the indifference curve of perfect substitute goods is a 45 degrees straight line.
The indifference curves can also be seen in figures 1 and 2 (see the red-colored lines at the base of the plots).
From the utility function (1) U = x + y we extract:
y = U - x (6)
Fixing the utility level, we can plot the indifference curve:
Figure 3: Indifference Curves of Perfect Substitute Goods
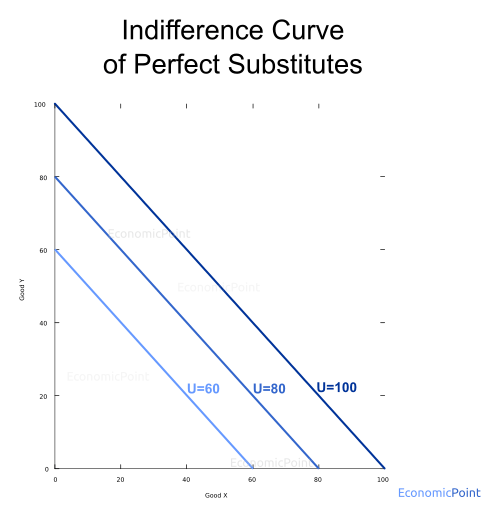
The marginal rate of substitution (MRS) is the slope of the indifference curve. As we said above: if a person consumes one less unit of a perfect substitute good, she will need an additional item of the other perfect substitute to keep the same utility level.
This means that the MRS is constant along the indifference curve.
Now, we will incorporate the budget constraint. Total spending can fall short of the budget constraint but cannot exceed it. The budget line is also straight.
Px X + Py Y ≤ B (7)
Then:
Y = B/Py - Px/Py X (8)
The budget line is also a straight line with slope Px/Py
The consumer will seek to maximize its utility given the budget. She will choose the combination of goods that give her the indifference curve that is farthest away from the origin.
If we set the budget to $80, and the price of X is $1 and the price of Y is $2. The consumer will spend all of her budget in good X, because it’s the cheapest one, as can be seen in the next figure:
Figure 3: Perfect Substitute Goods: Indifference Curve and Budget Line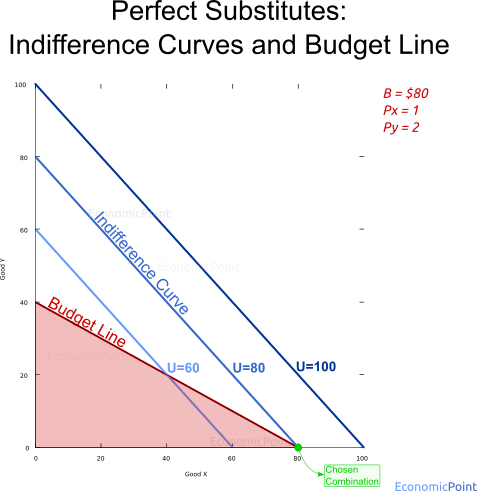
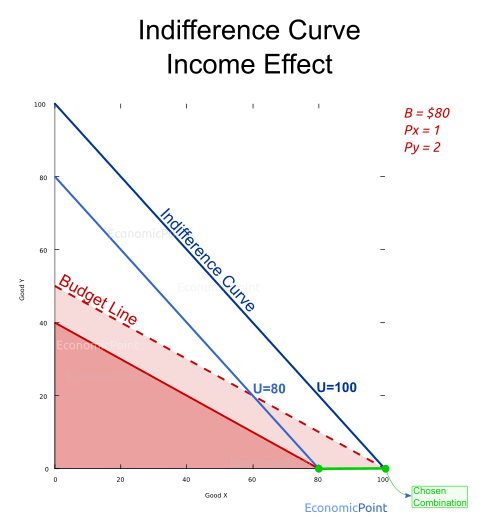
Perfect Substitute Goods Income Effect
If the budget increases, the consumer will have a budget line farther away from the origin. For example, if the consumer increases its income and it’s budget increases to $100, ceteris paribus, she will keep spending all her budget in good X, but her utility level will increase to 100.
Figure 4: Perfect Substitute Goods: Income Effect
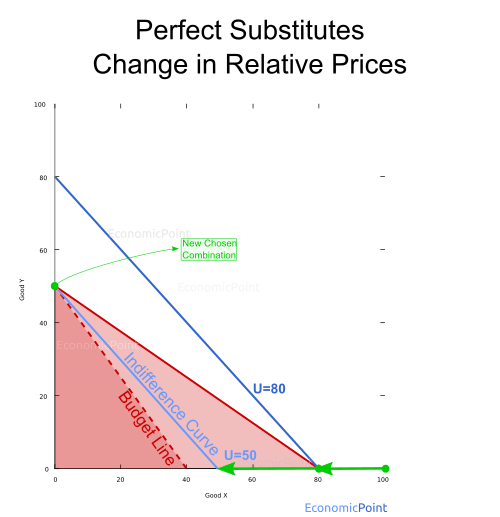
Perfect Substitute Relative Price Change Effect
Let’s now see what happens if prices change. Any price change will modify the budget line. If the price of X is lower than the price of Y and the price of Y increases, the consumer will keep spending all her budget in good X. Utility will not change.
If the price of X increases, but it is still lower than the price of Y, she will keep spending all her budget in X, but she the quantity purchased will be lower and the utility will decrease.
Figure 5: Perfect Substitute Goods: Relative Price Change Effect

If the price of X keeps increasing up to a point where it is higher than the price of Y, the consumer will stop buying X and spend all her budget in Y. Again, the utility level will decrease.
Figure 6: Perfect Substitute Goods: Relative Price Change Effect
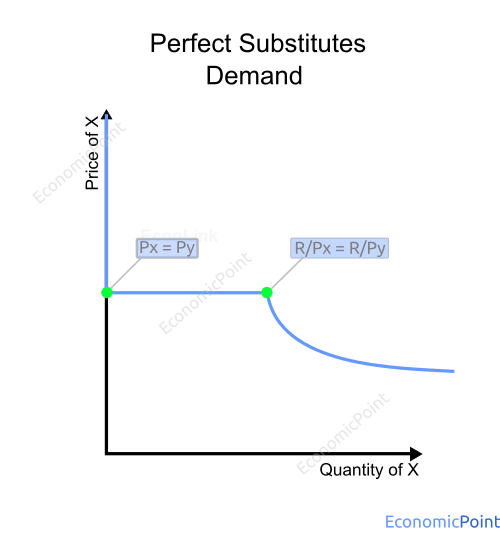
Demand Function for Perfect Substitute Goods
The demand function for perfect substitutes can be described as follows. If the price of X is lower than the price of Y, the demand will be a function of the price of X. If the price of Y is lower than the price of X, the demand will be a function of the price of Y. The demand function is the same is both cases.
If prices are equal, the total quantity demanded is a function of the price. There is a mix of X and Y, but the model doesn’t determine the exact amount of each good.
Then:
X = f(Px) and Y = 0 for px < py
Y = f(Px) and X = 0 for px > py
X + Y = f(Px) for px = py
Where:
X: quantity demanded of good X.
Y: quantity demanded of good X.
Px : Price of X.
Py : Price of Y.
f(Pi) : Demand function.
Figure 7: Demand for a Perfect Substitute Good
Cross Elasticity of Perfect Substitute Goods
The cross elasticity measures the responsiveness of the quantity demanded when the price of another good changes. It is defined as the percentage change in the quantity demanded divided by the percentage change in the price of the second good.
exy = (ΔX/X)/(ΔPy/Py)
In the case of perfect substitute goods, the cross elasticity is either 0 or tends to infinite. It is 0 if the price change doesn’t modify the quantity consumed for the other good. For example, if Px = 10 and Py = 12, and the new Py is 11. The consumer will keep spending all her budget in X because it is the cheaper good.
But if the price of Y decreases to 9, the consumer will stop buying X and spend all her budget in Y. In this case, the cross elasticity is infinite.
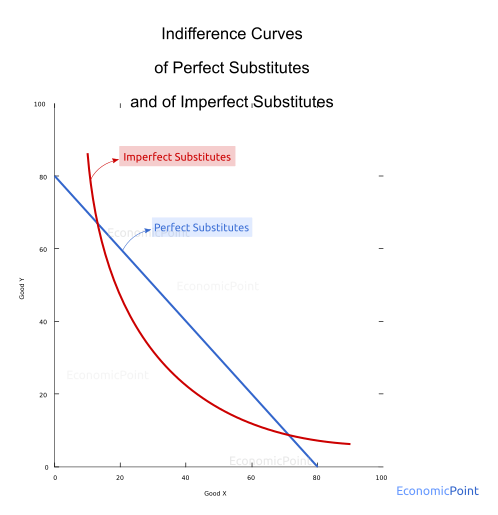
Perfect Substitutes vs. Imperfect Substitutes
Imperfect substitutes have a lesser level of substitutability. In the case of imperfect substitutes, if a person consumes one less unit of an imperfect substitute, she will need more than one or less than one additional item of an imperfect substitute to keep the same utility level. The indifference curve is not a straight line.
Figure 8: Perfect Substitutes vs Imperfect Substitutes
Examples of Imperfect Substitutes are:
- Coca-Cola and Pepsi.
- Bikes of different qualities.
- A high-end laptop and a lower brand laptop.
- Tea and coffee.
- Beer and wine.
- Car, motorbike, bike and public transport.
- Butter and margarine.
- Bananas and Apples.
For some consumers, a pair of goods can be perfect substitutes while for other people, the same pair of goods can be imperfect substitutes. For example, someone can perceive butter and margarine as perfect substitutes, while others might prefer one over the other.


