Demand Definition: In economics, demand is the quantity of a good that consumers are willing and able to purchase.
The most important determinants of demand are:
- Price of the good.
- Price of related goods.
- Disposable income.
- Consumer’s preferences.
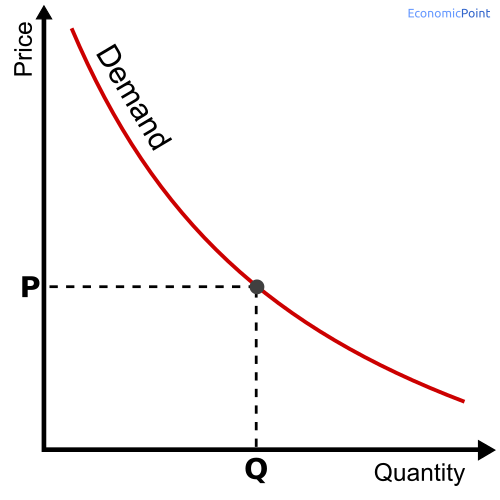
The Demand Curve and the Law of Demand
The demand curve is a graph that describes the relationship between price and quantity demanded.
The price is plotted on the vertical axis, and the quantity is plotted on the horizontal axis.
The law of demand is a principle that states that there is an inverse relationship between price and quantity demanded. When the price of a product increases, the demand for that product will fall.
Because of the law of demand, the demand curve has a negative slope.
Changes in Demand
When any determinant of the demand changes, the demand increases or decreases. If there is a change in the price of the good, there is a movement along the demand curve. If there is a change in any other determinant, as the disposable income, there is a shift in the demand curve.
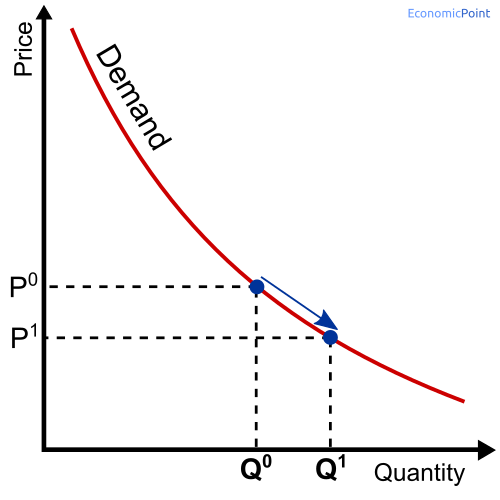
Movement along the Demand Curve
There is a movement along the demand curve when the price of the good changes. For instance, if the price of the good falls, the demand increases.
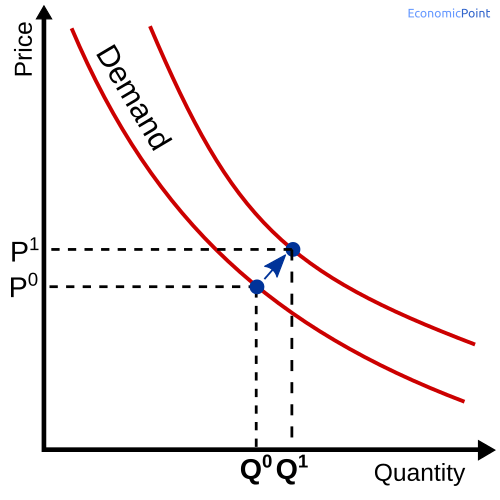
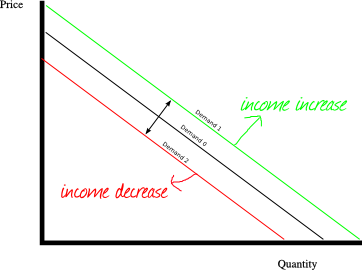
Shifts in the Demand Curve
When a determinant other than the price changes, there is a change in the demand. But the whole demand curve moves. For instance:
- If disposable income increases, the demand curve will shift upwards.
- If the price of a complementary good increases, the demand curve will shift downwards.
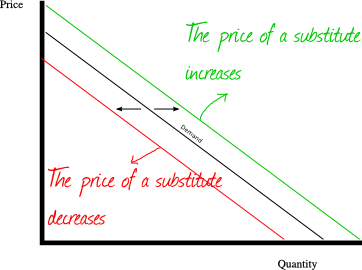
- If the price of a substitute good increases, the demand curve will shift upwards.
- Whenever there is a change in consumers’ preferences, the demand curve can shift downwards or upwards.
Example of Demand
Let’s suppose that the following table and chart show the relationship between the price of the iPhone 12 and its quantity demanded per month (in thousands).
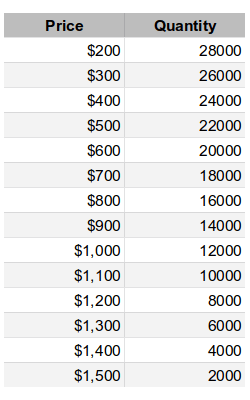
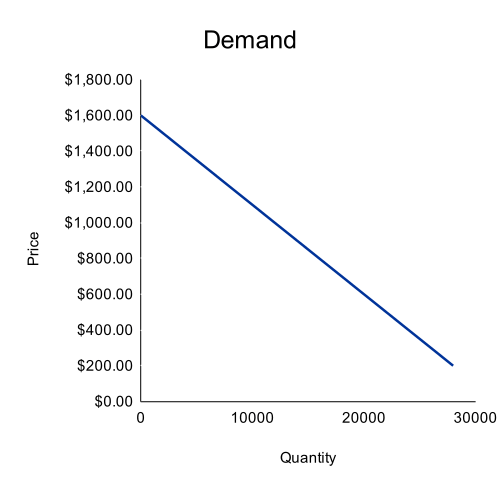
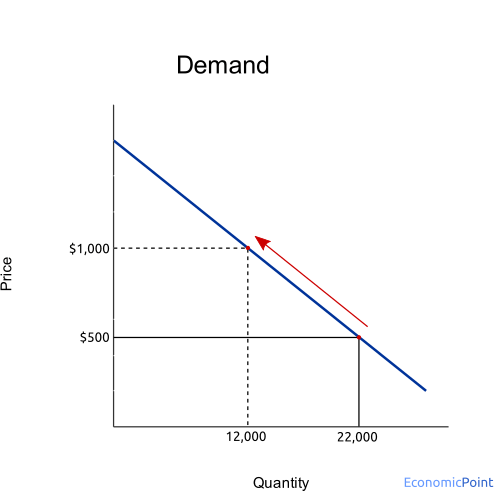
If the price of the iPhone is $500, there will be 22 million iPhones sold per month. If Apple decides to increase its price to $1,000, the number of iPhones sold per month will be 12 million. This is a movement along the demand curve, as shown in the following chart.
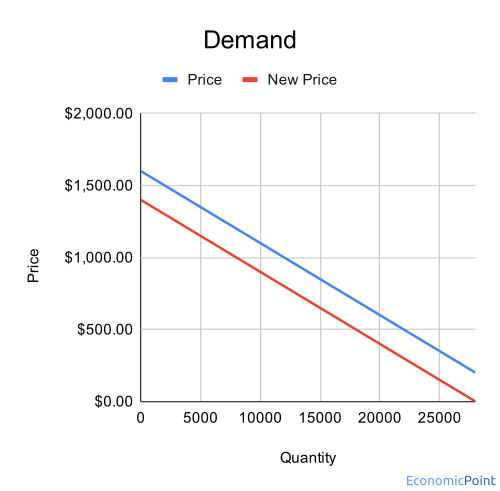
Now, if Google launches a much better Nexus phone (a substitute good) at the same price tag, the demand of the iPhone will shift down, as can be seen in the following graph:
Elasticity of Demand
The elasticity of demand is a measure of the responsiveness of the quantity demanded. As we saw above, the quantity demanded depends on several factors.
According to the factor, we have several types of elasticity of demand according to the source of the change in the demand. For example, if the price is the source of the change, we have the “price elasticity of demand”.
According to the source of the change in the demand, we have several types of elasticities of demand:
- Price Elasticity of Demand: when the price of the good or service changes.
- Cross Elasticity of Demand: when there is a change in the price of a substitute or complementary good.
- Income Elasticity of Demand: when there is a change in disposable income.
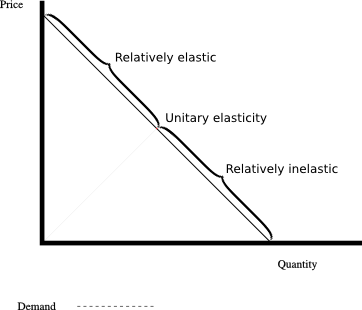
According to the degree of the change in the demand, the elasticity of demand can be classified in:
- Perfectly Elastic
- Relatively Elastic
- Unit Elasticity
- Relatively Inelastic
- Perfect Inelastic
Price Elasticity of Demand

The price elasticity of demand is the proportional change in the quantity demanded, relative to the proportional change in the price of the good.
Price elasticity of demand = Percentage change in quantity demanded / percentage change in price = ΔQ/Q / ΔP/P
Cross Elasticity of Demand
The cross elasticity of demand is the proportional change in the quantity demanded, relative to the proportional change in the price of another good.
Price elasticity of demand = Percentage change in quantity demanded / percentage change in the price of another good = ΔQ1/Q1 / ΔP2/P2
Looking at the chart, the change in the price of another good shifts the demand curve to the left or to the right.
If the two goods are substitutes, the cross elasticity of demand is positive.
If the two goods are complements, the cross elasticity of demand is negative.
Income Elasticity of Demand
The income elasticity of demand is the proportional change in the quantity demanded, relative to the proportional change in the income.
Income elasticity of demand = Percentage change in quantity demanded / percentage change in income = ΔQ/Q / ΔI/I
According to the value of the elasticity
Up to here, we have pointed out different types of elasticity according to the function we are analyzing, and according to the inputs we are considering. Now we will see how the supply and the demand can be classified according to the value of the elasticity.
Perfectly Elastic Demand: EP → -∞
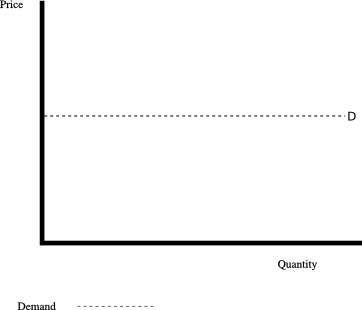
Perfect Elastic Demand: The elasticity tends towards -∞.
When the demand is perfect elastic, a minimal price increase will cause the demand to be zero.
Relatively Elastic Demand: -∞ < EP < -1, unit elasticity demand and relatively inelastic demand
Perfect inelastic demand: EP = 0
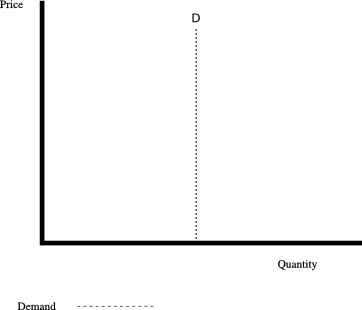
A perfect inelastic demand has an elasticity of 0. The quantity demanded will not change despite changes in the price.