The payback period is the time it takes for a project to recover the investment cost. For example, if you invest $100 and the returns are $50 per year, you will recover your initial investment in two years.

The payback period is a simple and quick way to assess the convenience of an investment project and to compare different projects. For example, if project A has a payback period of three years, while project B has a payback period of four years, you will choose project A.
Can you notice an issue with the payback period? Think for a moment. OK, the payback period has two main issues:
- It doesn’t take the time value of money into account.
- It doesn’t take into account all the cash flows that happen after the accumulated cash flow is zero.
The time value of money is an economic concept that refers to the fact that money available in a near future is worth more than the identical sum in the far future.
The payback period can be seen as the time it takes a project, to reach an accumulated cash flow of zero. But two different projects can have the same payback period, while the first one has larger positive cash flows after the payback period. Clearly, the first one is preferable.
Alternatives to the Payback Period
Because of the issues with the payback period, the Internal Return Rate (IRR) and the Net Present Value (NPV) are better alternatives to the PP. These measurements do take the time value of money and all the cash flows into account.
Examples of the Payback Period
Same cash flow every year
When the cash flow remains constant every year after the initial investment, the payback period can be calculated using the following formula:
PP = Initial Investment / Cash Flow
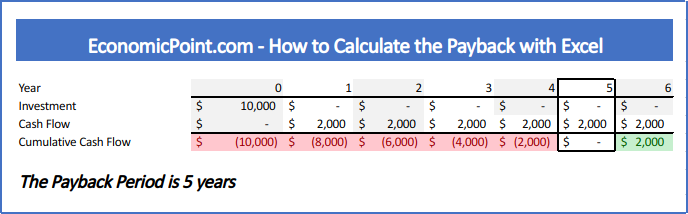
For example, if you invested $10,000 in a business that gives you $2,000 per year, the payback period is $10,000 / $2,000 = 5
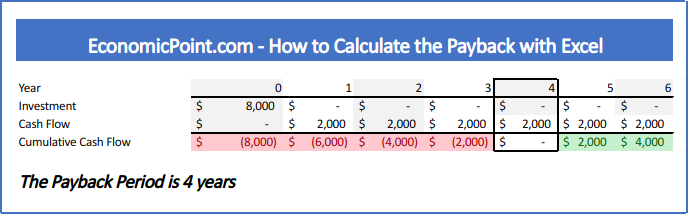
If you invested $8,000 and the cash flow remains $2,000 per year, the payback period reduces to 4 years:
Another way to view the payback period is to check when the accumulated cash flow, including all the investments, equals zero. But sometimes this is not so easy, because there is a period of negative accumulated cash flow followed by a period with positive accumulated cash flow. There is no period with zero accumulated cash flow.
In this case, what period do we take into account? The first one or the second one?
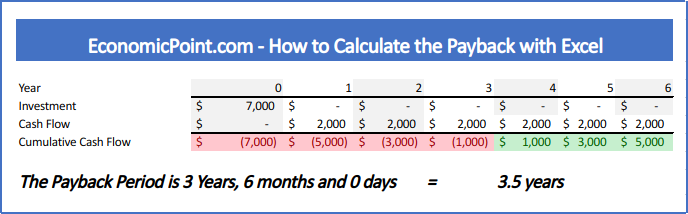
When there is no period of zero accumulated cash flow, the payback period will be a positive rational number, not an integer. To calculate the payback, you must estimate the fraction of the year that passed since the cash flow was negative for the last time until it reached the zero value. For this estimation, we assume a linear behavior of the evolution of the cash flow.
If the absolute value of the last negative accumulated cash flow is the same as the first accumulated positive one, the fraction is 0.5, like in the following example:
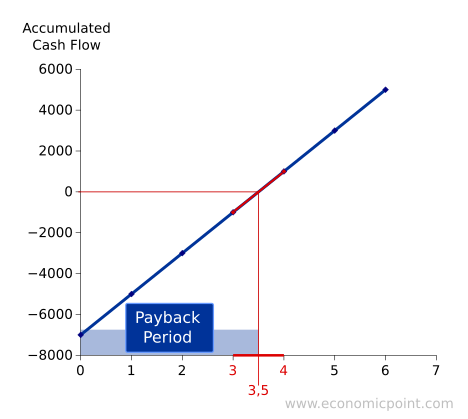
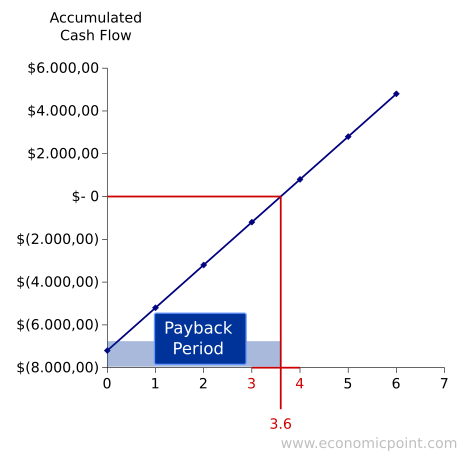
In the following plot, we can see the evolution of the accumulated cash flow:
When the absolute value of the last accumulated cash flow is not the same as the first positive cash flow, the fraction will not be 0.5:
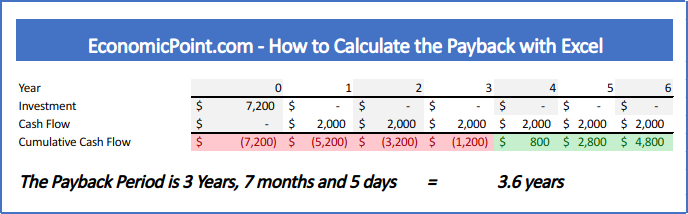
How to Calculate the Payback Period in Excel
While is it possible to have a single formula to calculate the payback, it is better to split the formula into several partial formulas. This way, it is easier to audit the spreadsheet and fix issues.
Follow these steps to calculate the payback in Excel:
- Enter all the investments required. Usually, only the initial investment.
- Enter all the cash flows.
- Calculate the Accumulated Cash Flow for each period
- For each period, calculate the fraction to reach the break even point. Use the formula “ABS”
- Count the number of years with negative accumulated cash flows. Use the formula “IF”
- Find the fraction needed, using the number of years with negative cash flow as index. Use the formula “INDEX”
- To get the exact payback period, sum the number of years with negative accumulated cash flow and the corresponding fraction
Shameless plug: We created an Excel file to calculate the payback. It updates automatically and allows to enter multiple investments, not only an initial investment. It displays the payback using fraction years and also years months and days. Actually, we used this file to create our examples, you can get it for only $5 using the following link: