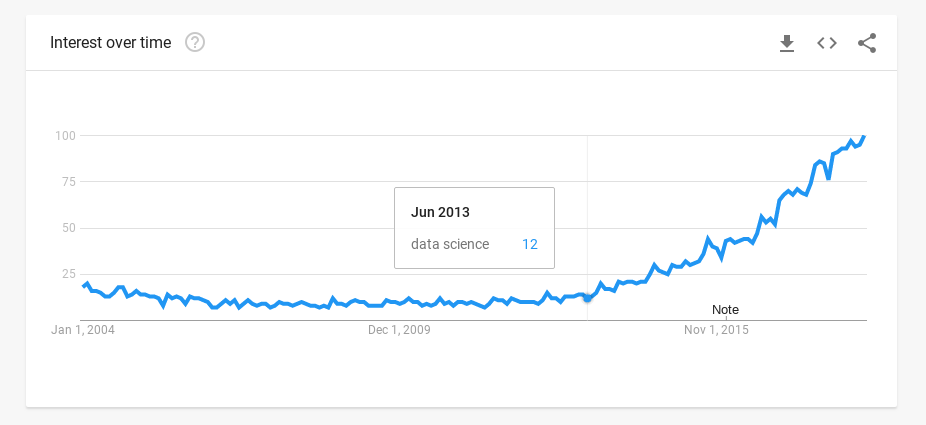
Interest in Data Science exploded in the last years. As you can see in the following chart from Google Trends, the number of searches of the term “Data Science” has been increasing fast since 2013.
We hear in the media that many big tech companies, like Google, Amazon and Facebook are heavily using data science in their business. Google uses data science, for example, to deliver better search results by predicting the search intention. Google also uses data science to analyze pictures on the web. But nowadays, thousand of companies are jumping into data science to better understand data in order to better deliver products and services. This trend is helped by the digitization of business processes. Also, many labs and scientist are increasingly using data science to better understand different phenomena. Data science can be used in a variety of disciplines and careers.
Several research centers are investing heavily in Data Science, including the University of California Berkeley, the New York University, the MIT and the University of Michigan.
What is Data Science
Data Science is a group of tools, techniques and disciplines that focus on converting large amount of data into valuable information that can be used to explain the relationship between several variables, generate prediction models and ultimately better deliver products or services.
Data science uses several multidisciplinary knowledge. A lot of these knowledge comes from hte fields of Computer Science and Statistics. A well known diagram was created by Drew Conway:

Data science is in the intersection of Hacking Skill, Math and Statistics Knowledge and Expertise in the field. A good data scientist also has a dose of skepticism and can generate replicable results. Without those skills, it would be more data management and manipulation, but not science.
Data science also includes communication skills. DS can generate several visualizations to better communicate the results: Charts, Graphs and other kind of visualizations.
Breaking down Data Science
Data science relies heavily on computers to process data, create several models that explain the relation between several variables, test those models using different combinations of variables and parameters and choosing the best models according to the explanation power or usefulness of them.
The process of converting data into information includes the following 6 activities (taken from David Donoho “50 Years of Data Science”):
1- Data exploration and preparation. This part is usually called “data clean up”.
2- Data Representation and Transformation (Tabular form, Text form and Graphs Based Data)
3- Computing with Data
4- Data Modelling: Generating several algorithms and/or regressions and statistically test the performance and explanation power of each algorithm. Computer allows the quickly check the power of the models generated in this phase, automatically update the parameters and generate new variables combinations and parameters according to the results (machine learning). Choosing the best algorithm/regression based on it’s power to generate a prediction. This result can be used to create a model that could be used in the future, for example, to make accurate predictions based on new data (real time data or past data).
5- Data Visualization and presentation: Charts, Graphs, Plots and interactive environments.
6- Science about Data Science: a meta activity to understand what works and what doesn’t.
Programming Languages used in Data Science
Data Science relies on different programming languages and computing paradigms to do its job. Each language has it’s own advantages, and each of the previously mentioned activities can use a different language. But some of the best languages for Data Science are Python and R.
Python is a general programming language that has many superb libraries for Data Science, like Pandas, NumPy and SciPy. Python is used on most of the top Computer Science courses.
R is more specific than Python: R is a programming language focused on data analysis, statistics and graphical models. R also has a good collection of packages.
R has a huge user base, but since Python is a general purpose language, Python has more users. Also, Python is more easy to learn.